A 3D Stock Heatmaps
Join the ApeMaps community on Meta Horizon to share insights and ideas
Overview
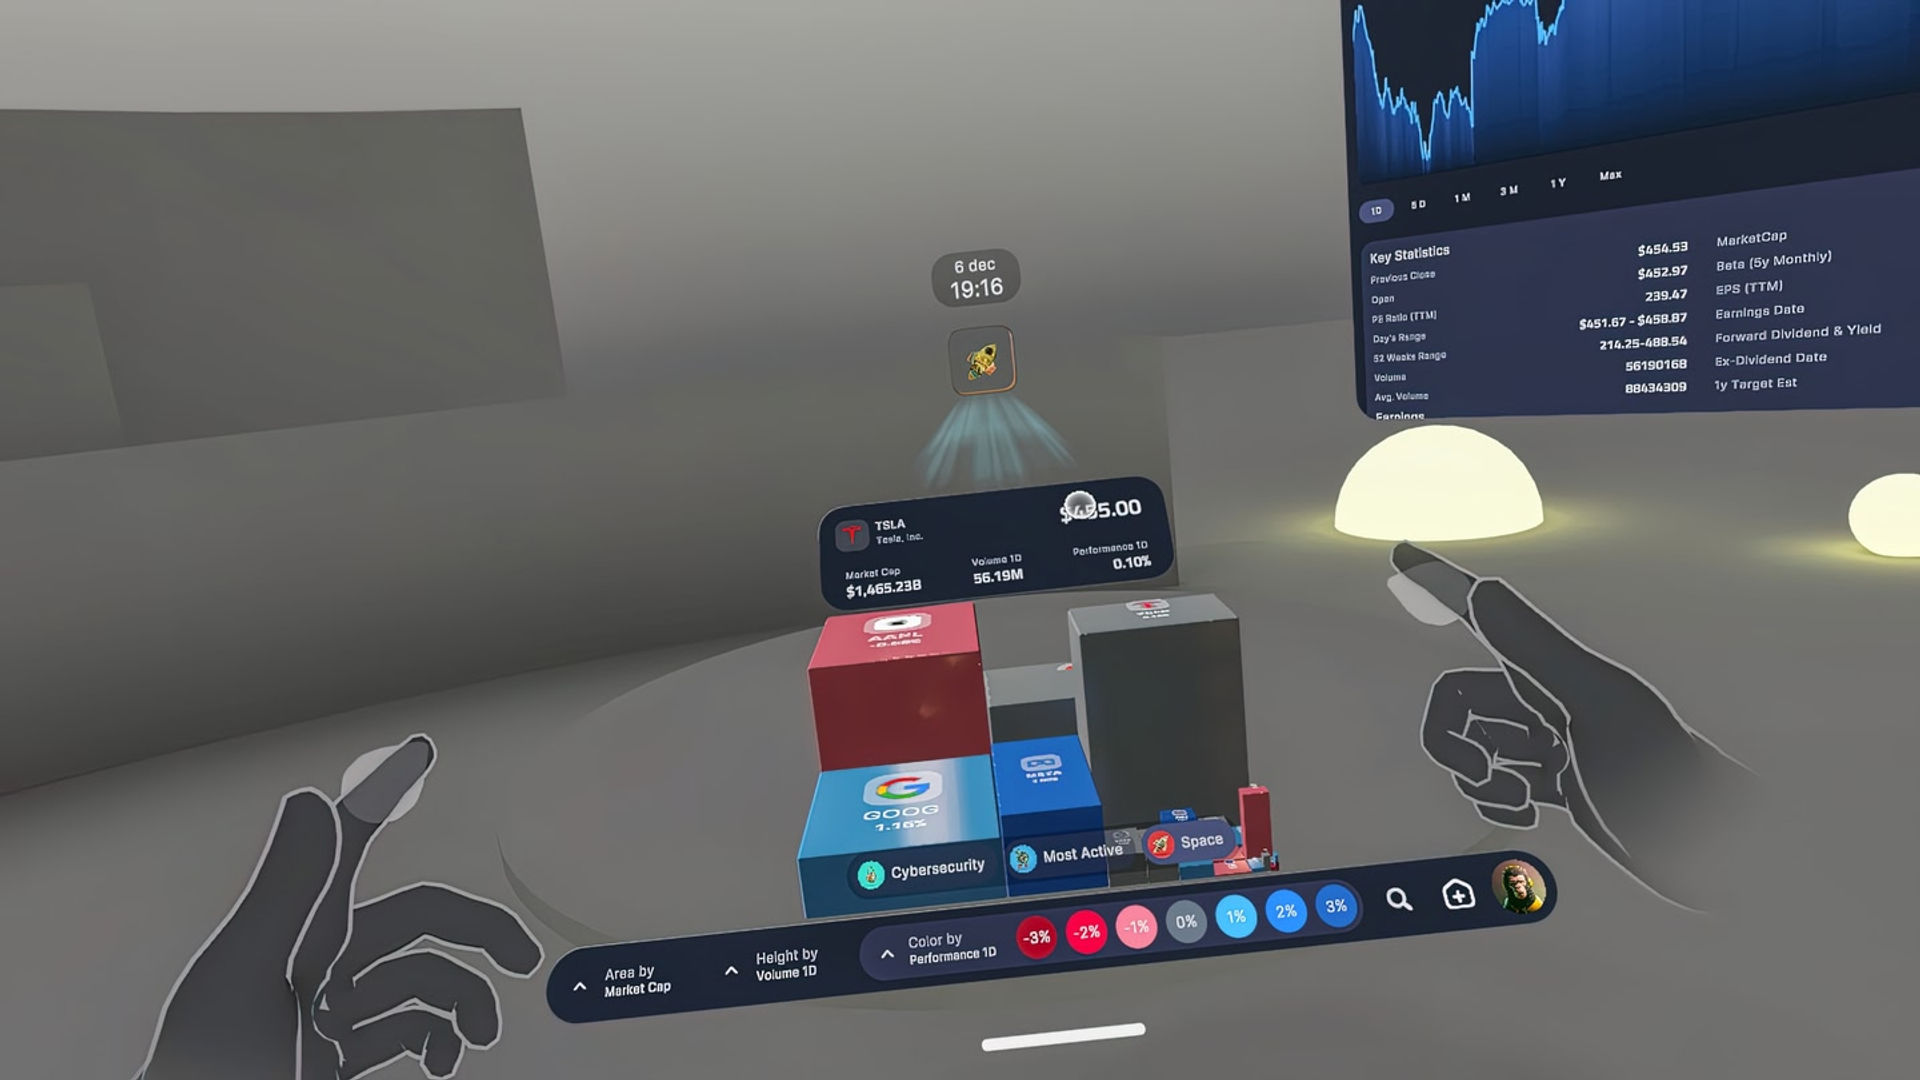
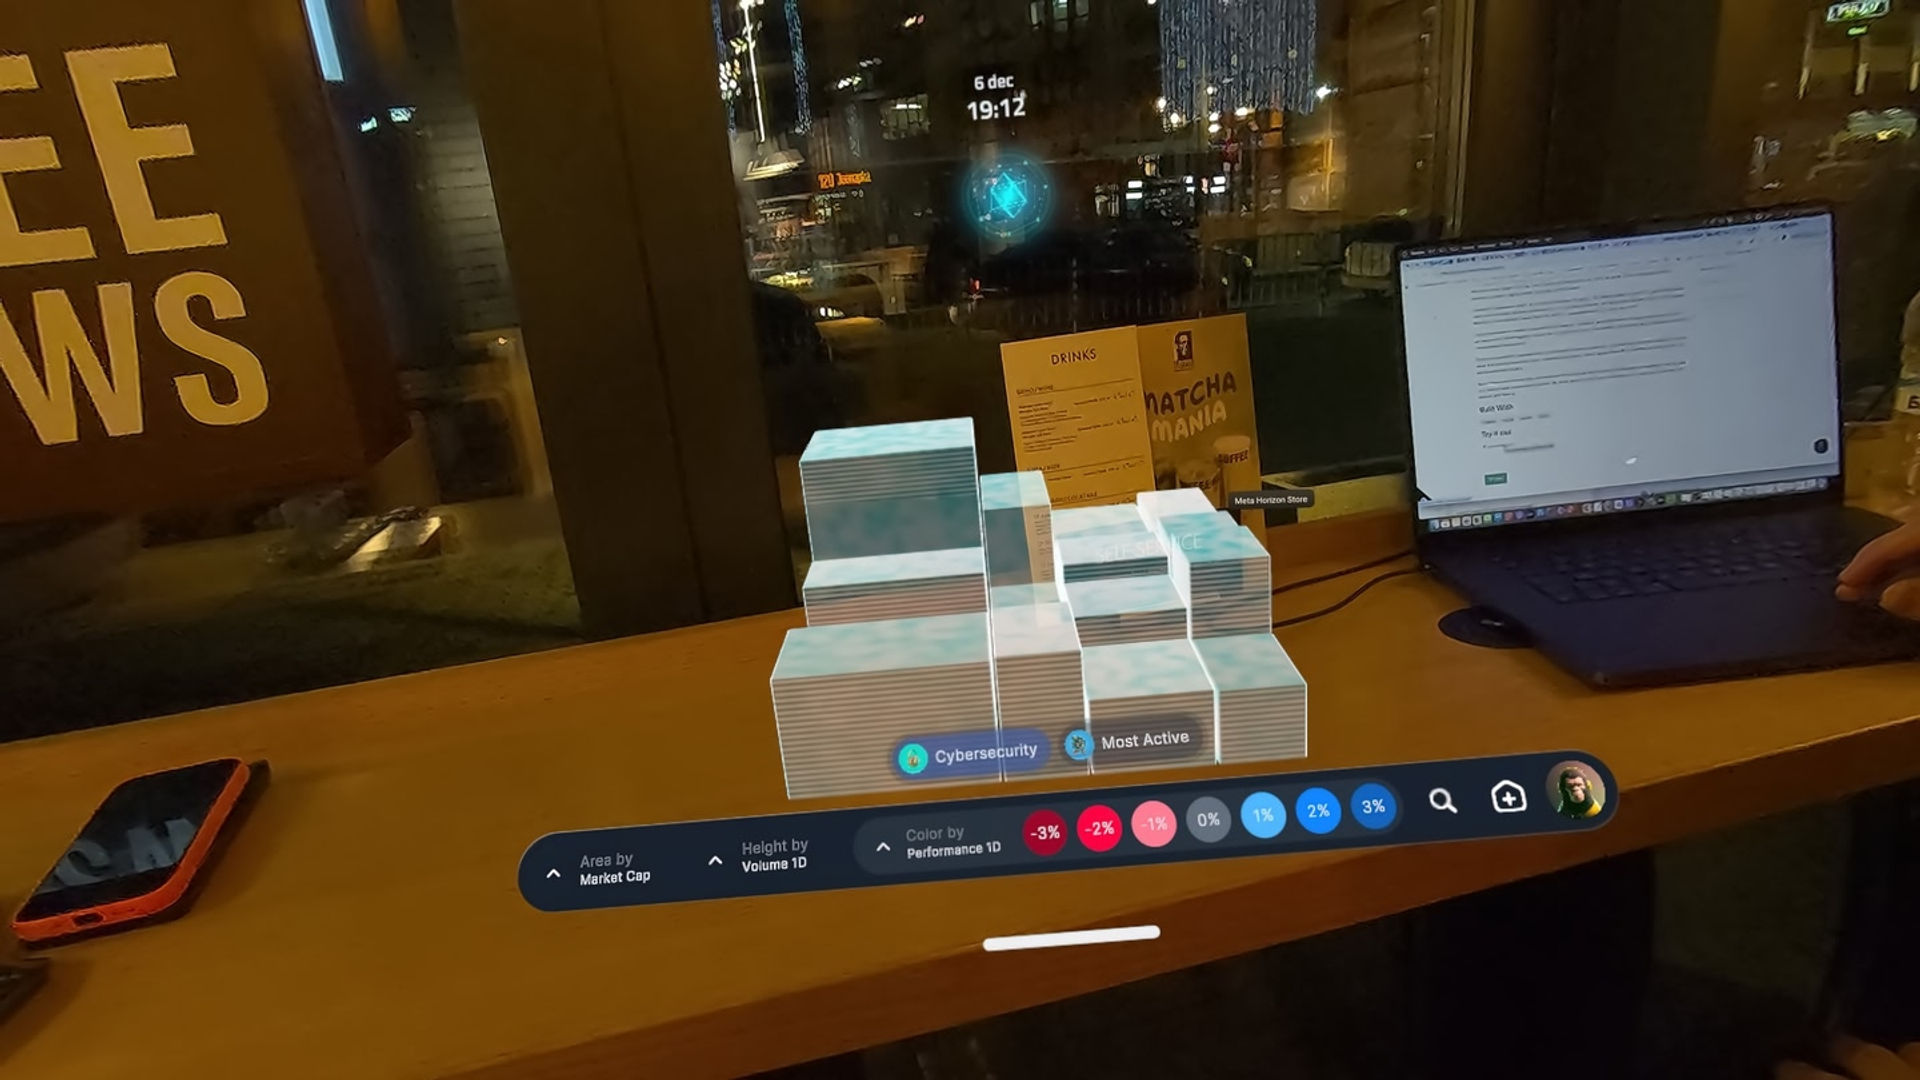
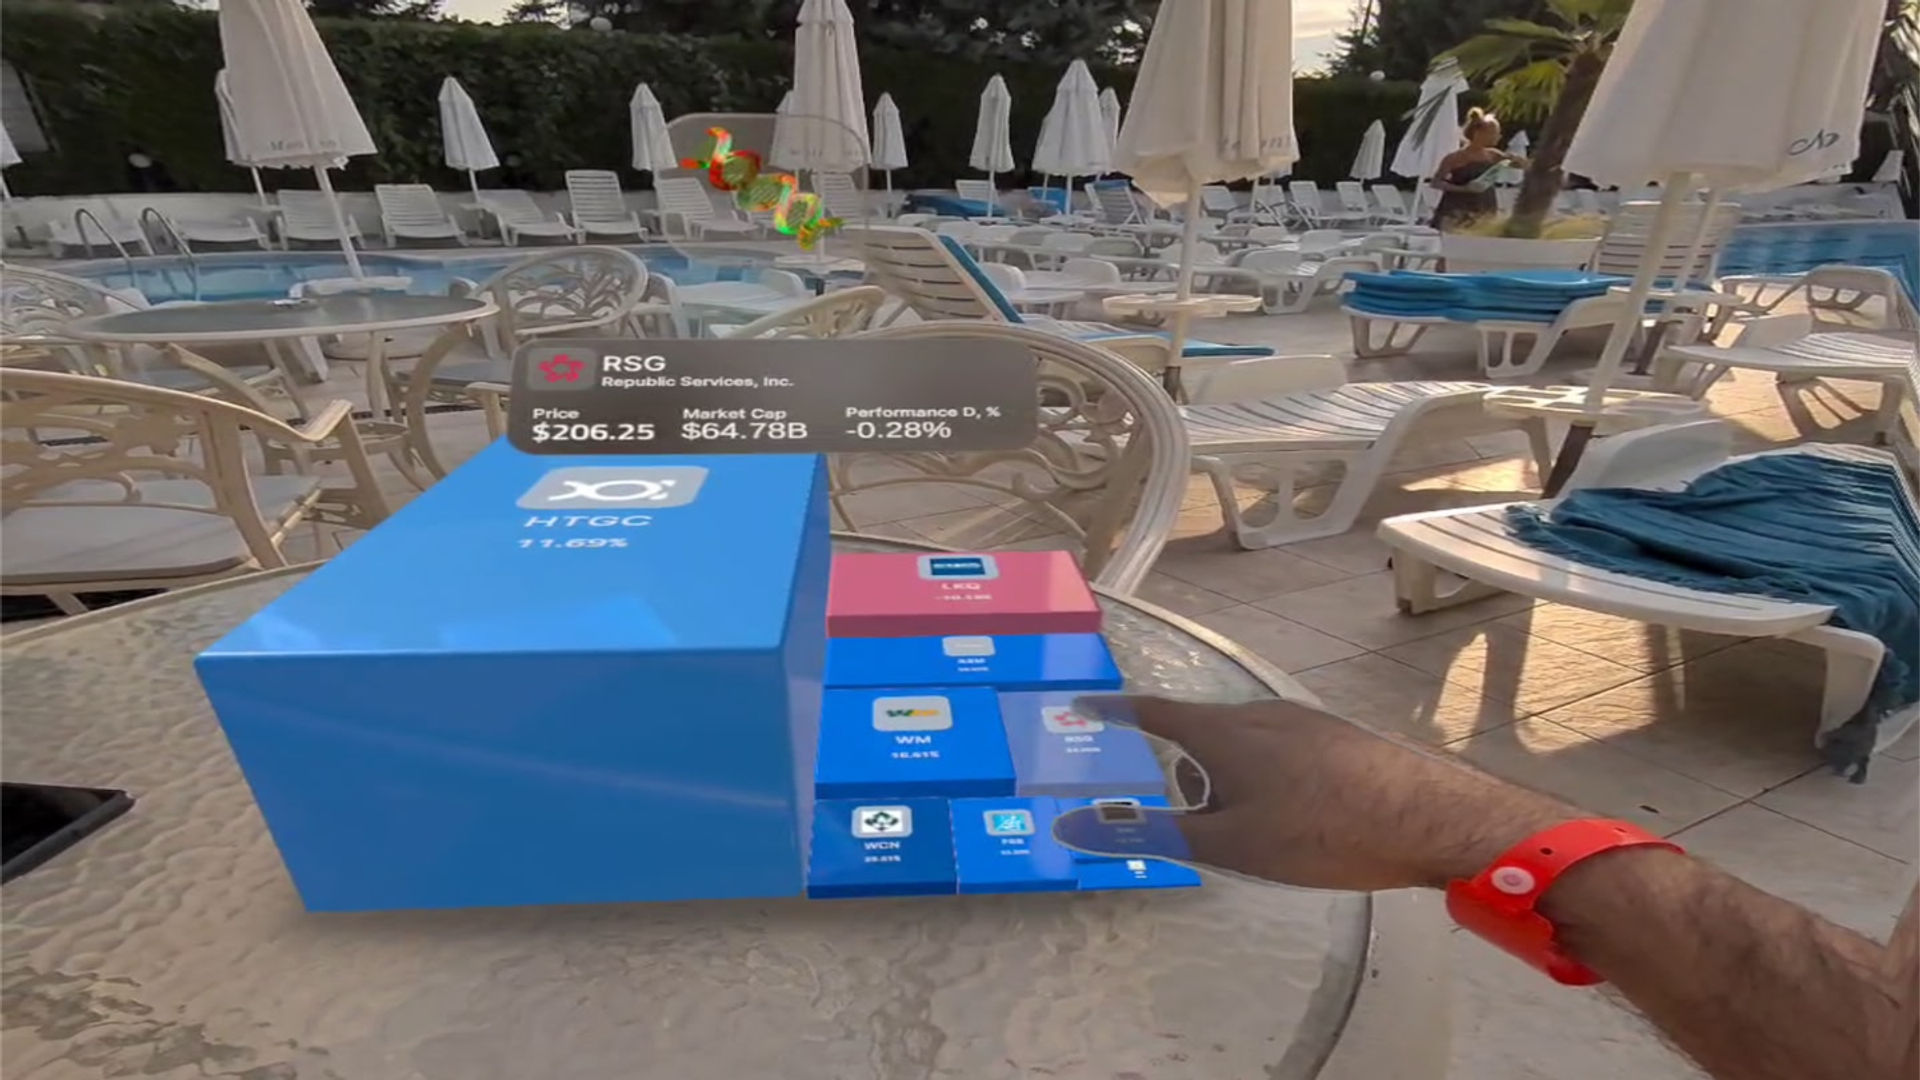
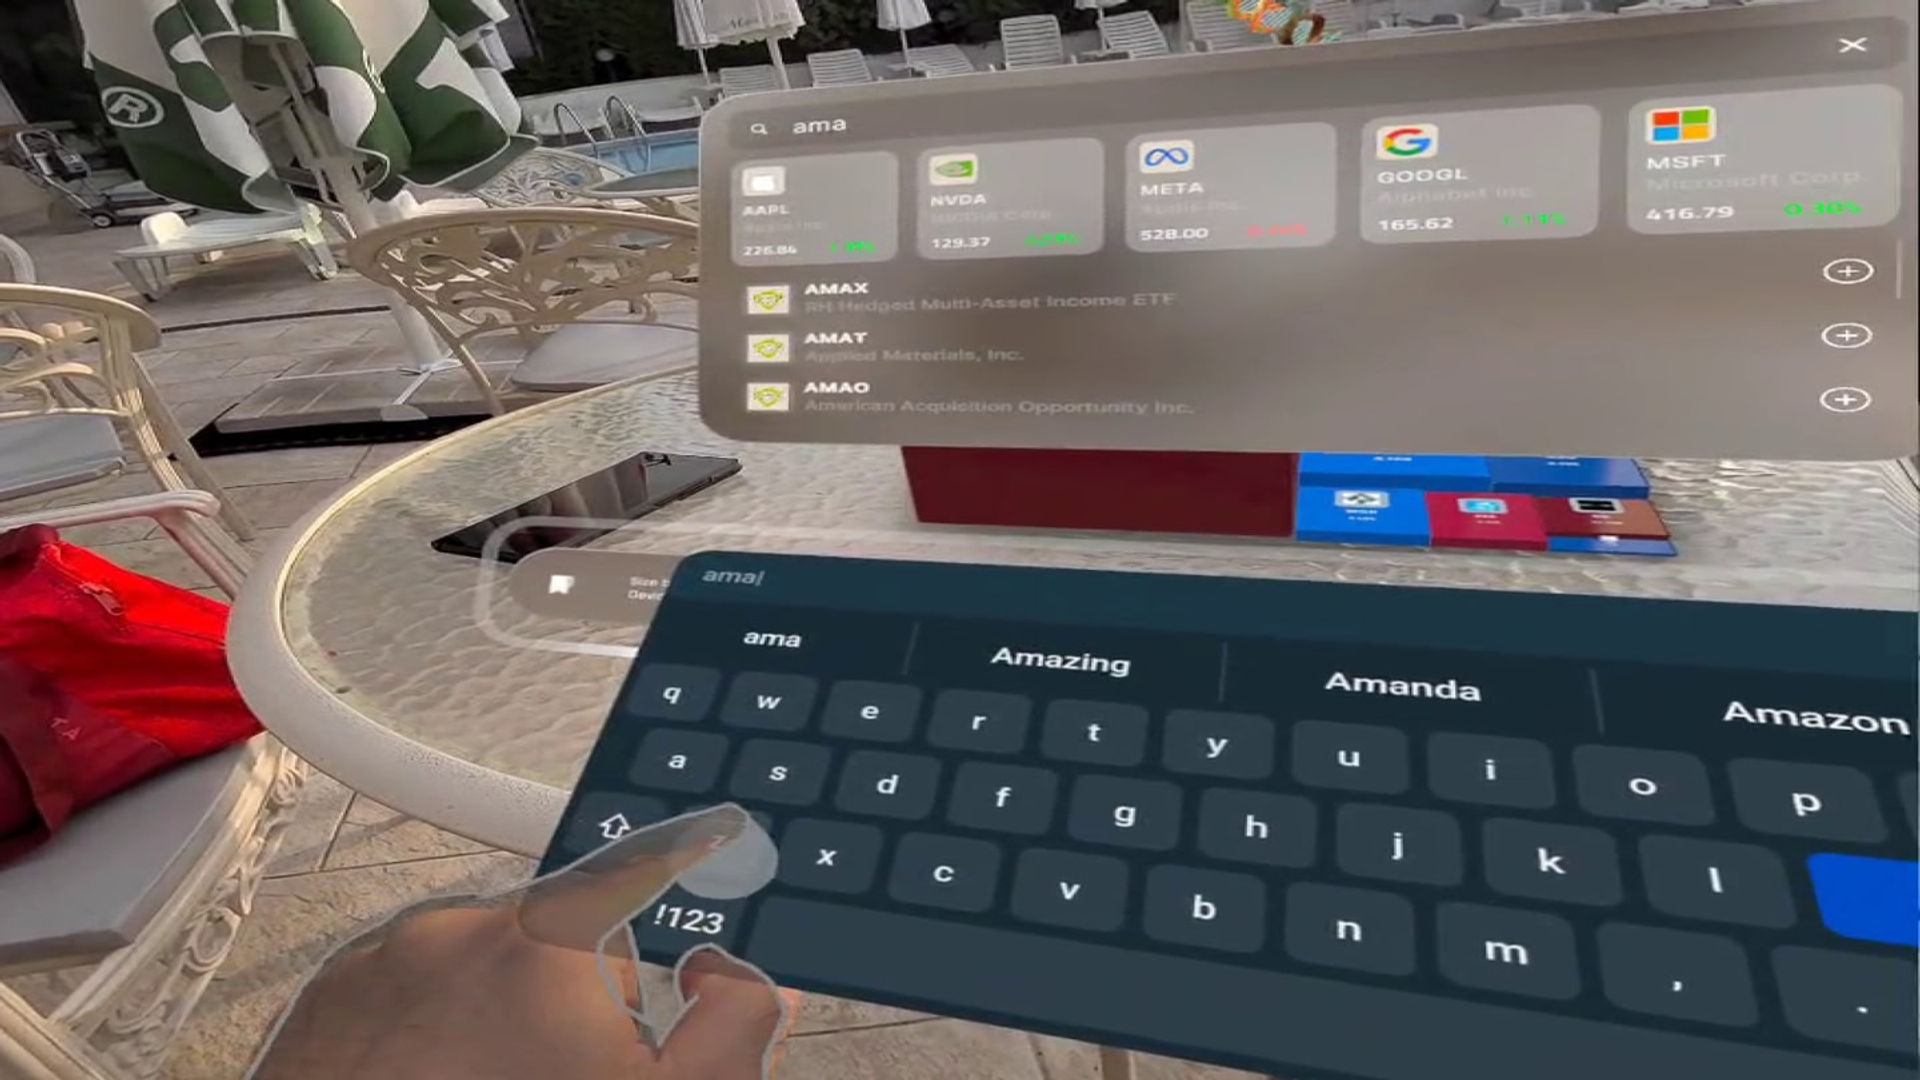
ApeMaps is a next-generation financial visualization tool for Meta Quest. Track stocks, financial instruments, and market data with interactive charts, and explore key ratios in immersive 3D heatmaps for faster insights. Switch seamlessly between VR and passthrough AR to analyze your portfolio anywhere.
Key Features
1. Immersive 3D Heatmaps
- Visualize stock prices, performance metrics, and key ratios across multiple companies.
- Detect trends, correlations, and outliers instantly in 3D.
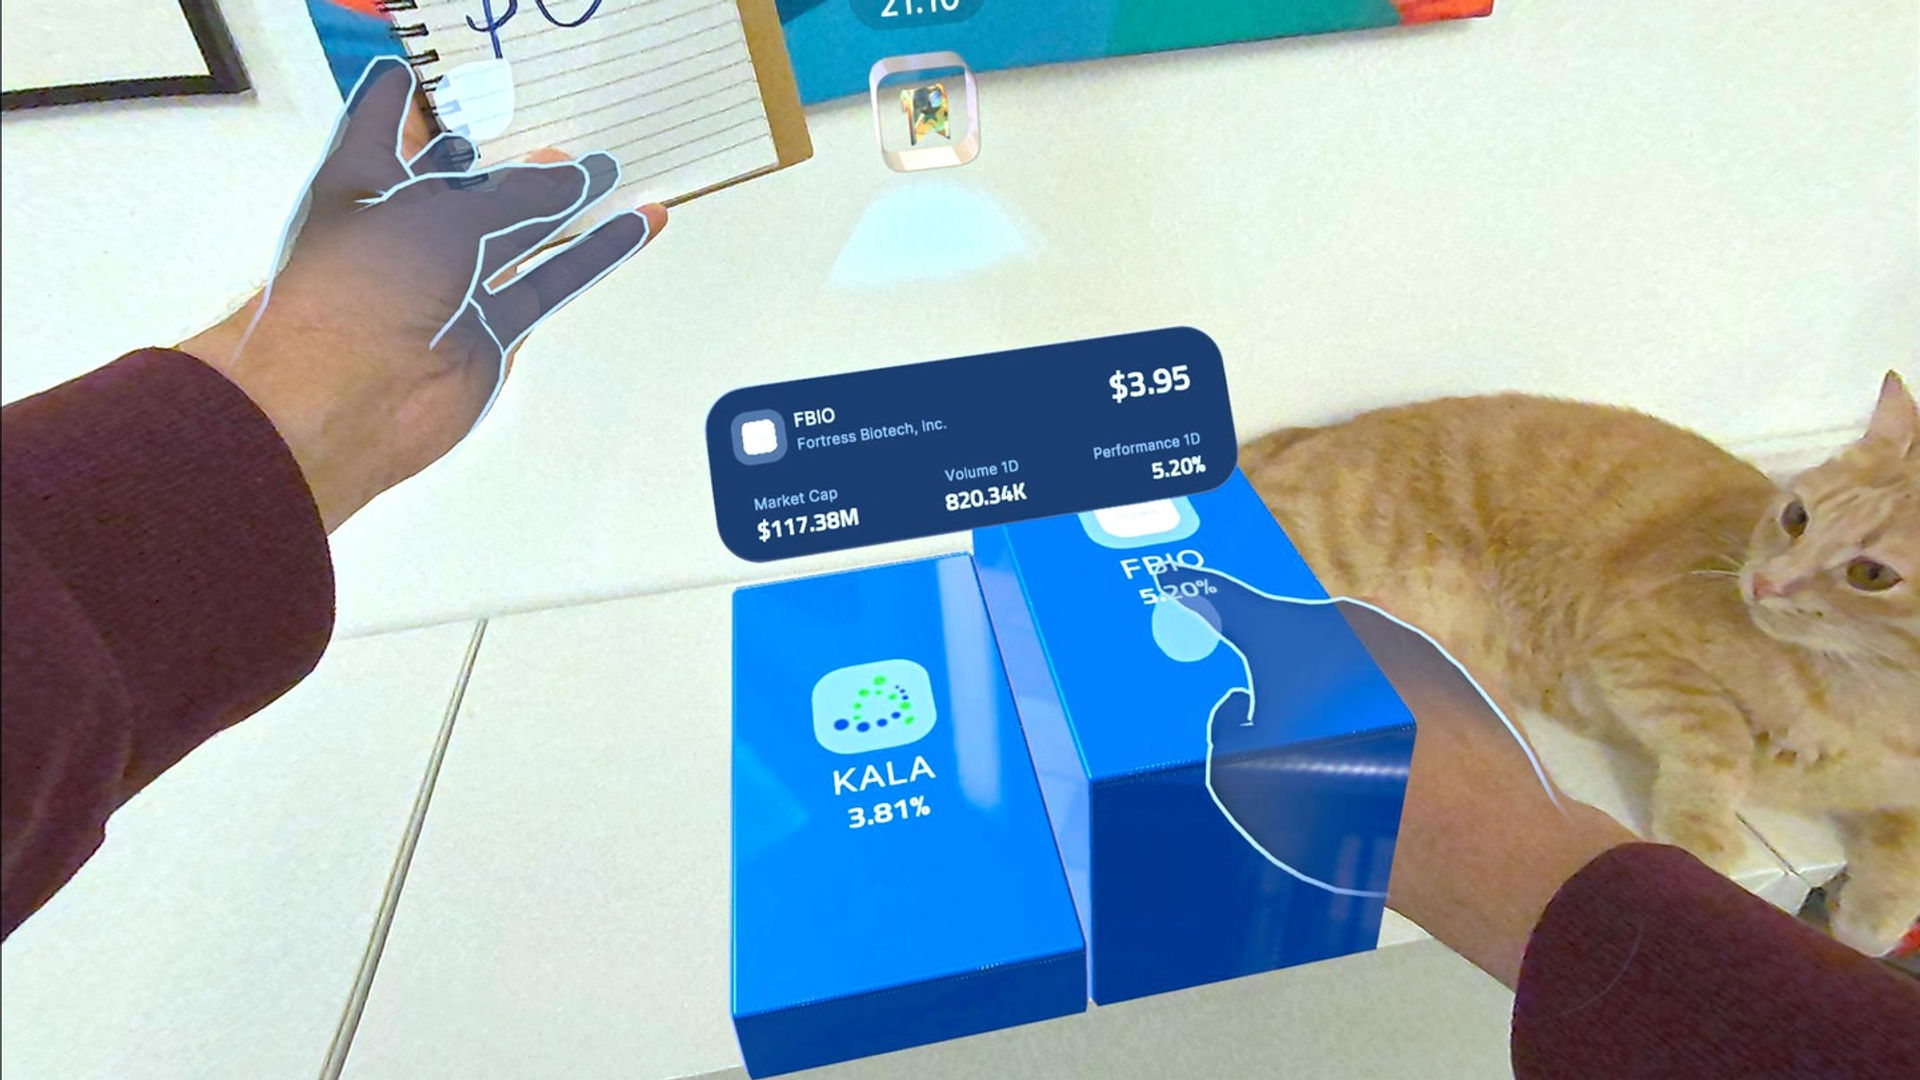
- Rotate and explore the heatmap with intuitive hand gestures.
- Tap on any stock or metric to reveal interactive line charts for deeper analysis.
2. Interactive Charts
- View data across different timeframes to track changes over time.
- See the number of comments from social networks for each stock or asset, giving insight into market discussion and sentiment.
3. Advanced Financial Analytics
- Analyze multiple stocks, indices, and financial instruments simultaneously in the 3D heatmap.
- Explore market trends and correlations at a glance using three dimensions: surface (e.g., market cap), height (e.g., volume), and color (e.g., performance).
Performance
ApeMaps runs smoothly on Meta Quest with minimal latency, providing a focused 3D experience. We’re continuously working to make performance even faster and more responsive.